
March 2024 – How big is the bid-ask gap in the market?
The Multifamily Investment Environment
Pricing uncertainty - a common topic as we attend industry events across the country. Obviously, there is a wide range of opinions of how deep this downturn will hit multifamily valuations before transaction velocity returns to normal.
The major four property indices cannot even agree on the dept of valuation cuts, with separate indices showing ranges from -15% to -32%.
One thing that is not uncertain is that a huge bid/ask gap exists in the marketplace. How large? One estimate from CRE Analyst closely corresponds with our view:
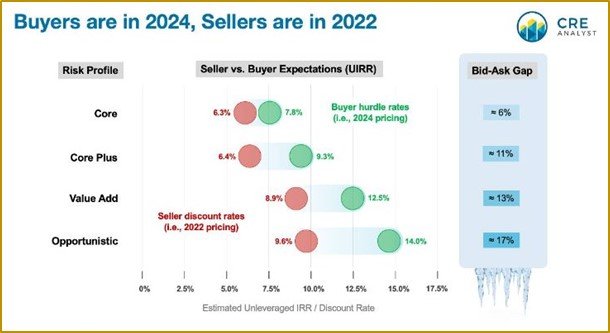
As can be seen from this chart, different asset categories show different bid/ask gaps to account for risk associated with each category. This risk-adjusted spread between categories completely disappeared during the five years leading up to the blow-off top the market experienced in 2022. This was a tell-tale sign the market had moved from “investable” to speculative. As with all bubbles, the period immediately preceding its collapse sucks in a great deal of capital from less experienced investors (speculators), most of whom are left without a chair when the music stops.
This leads us to an observation gleaned from the hundreds of presentations we have absorbed – the pricing gap expectations are to a considerable extent, a generational gap. It is amazing the $ billions of AUM that has been accumulated by sponsors that were literally in high school when the last downturn took place (GFC of 2008).
These sponsors have never experienced anything but declining interest rates and cap rate compression. These are powerful tailwinds, and nobody should be criticized for taking advantage of opportunity. Unfortunately, it is easy to mistake luck for skill, and this can be a fatal error in a cyclical industry such as real estate investment.
At a recent conference, I absorbed “market updates and forecasts” from three well-known but newer sponsors. The most experienced started in 2012 and the newest in 2018. Between the three, they controlled ~ $7b in AUM. The takeaway, interest rates are abnormally high and will drop to save the day!
Meanwhile, sponsors that have been through a few or more cycles have been conspicuously quiet in public. Behind closed doors, the message has been dramatically different – we are in the midst of a once in a generation structural deleveraging that will reset prices across the board. This is healthy for the long-term and will return multifamily to an investable sector.
The catalyst for this broad market reset? The forced sale of underwater properties as loan extensions begin to burn off in the second half of this year.

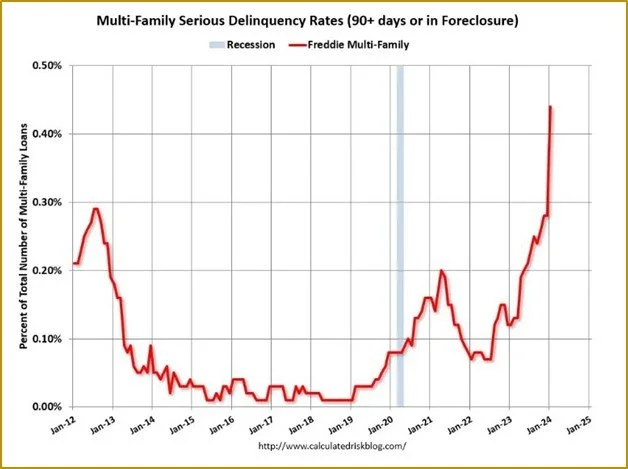
The wave of the troubled debt that has been building is now about to wash ashore, despite the best efforts of troubled sponsors and lenders wanting to keep loans in the performing category:

This is even beginning to show up in the agency debt that was much more conservatively underwritten. The delinquency rate for multifamily loans with FreddieMac just eclipsed the rate from the GFC of 2008.
The bottom line is that cycles take time to play out. Even more so if the cycle has a structural component such as the need to deleverage a sector broadly. The last structural pricing reset we experienced took six years from 1986 – 1992.
That reset was brought about by a flip flop on the tax laws, this one by a flip flop on interest rates (zero to long-term normal). It will be a brutal learning experience for the newer sponsors that survive. The differences between the winners and losers hasn’t been this wide in decades and will almost certainly get more pronounced.
For those with dry powder and a long-term historical perspective of the market, we believe 2024 will be the beginning of the best entry point in 17 years to employ our favorite investment strategy: buy low and sell high.
Expert Insights: The Capital Asset Pricing Model – a Common Sense Approach to Valuation
In its simplest form, the Capital Asset Pricing Model (CAPM) describes the relationship between expected returns and risk. In real estate this is known as a cap rate spread and it is used to show the additional yield an investor should expect from a property’s cap rate over a risk-free return (the 10-year Treasury) to compensate for the additional risks inherent in real estate investing.

CAPM is not perfect but any way you slice it, real estate investment is riskier than U.S. Treasuries – how much is open to interpretation. As with most markets experiencing dislocation, history provides us with long-term clues.
History tells us that the long-term medium cap rate spread is in the 3% to 4% range. Meaning, if the 10-year Treasury is at 4%, cap rates should be in the 7% - 8% range.

As mentioned, the CAPM as used to determine a cap spread is not perfect. It compares a static yield against a dynamic yield and does not account for flow of funds, tax incentives, etc., but it does provide a great common sense starting point to determine where multifamily pricing will eventually shake out.
Notice!
The Family Office Real Estate (FORE) Institute’s spring Investment Forum has moved to March 20-22, in Phoenix, AZ.

FORE Investment Forum 2024
This is a must attend event if you want to evaluate the best options to position your family office for upcoming destressed and opportunistic investment opportunities.
Please drop us an email if you would like to learn more about attending.